
A colleague opens the chart you sent yesterday. The number is different. Someone asks whether the model made a mistake. Another person suggests changing the prompt. Before either conclusion, there is a more useful question: are they looking at the same state of the data, using the same definition and filters?
An analysis worth handing over should make that question answerable. The chart helps someone see the result. The investigation explains what was counted, which alternatives were considered, and what the next person can safely continue. This article proposes a practical way to preserve that work. The numerical example is deliberately fictional. The product ideas described here are design directions, not a statement that every capability is available in DUKE today.
Start with a result someone else can reproduce
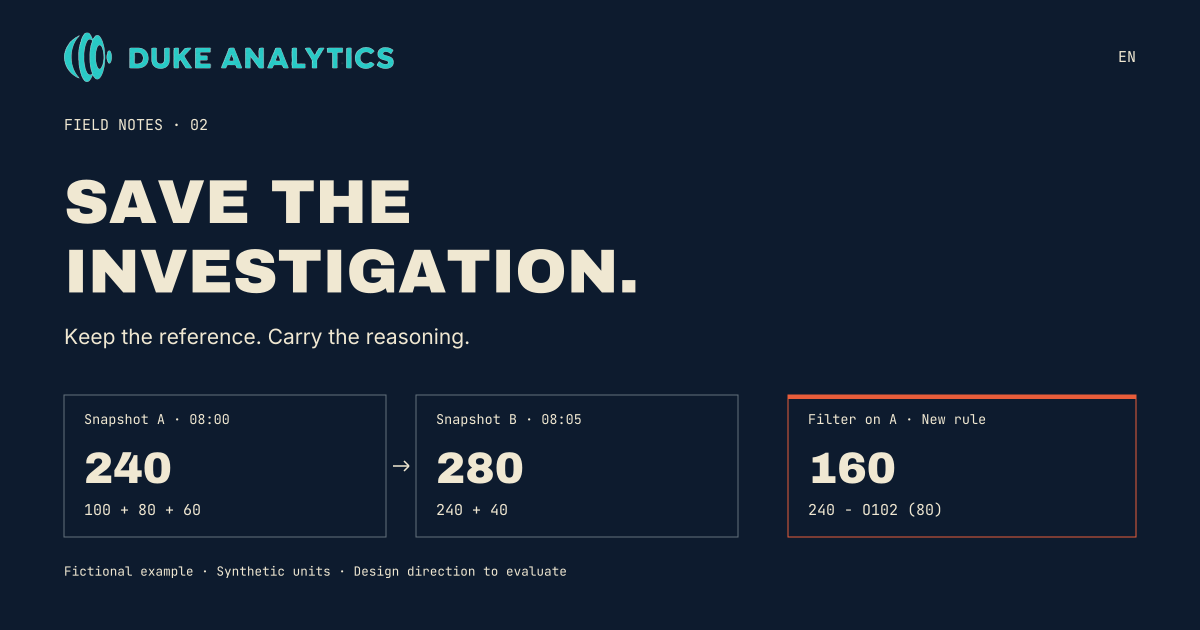
Consider a tiny demonstration dataset containing three recorded amounts in synthetic units: 100, 80 and 60. At 08:00, snapshot A contains those three rows. A query that sums all recorded amounts returns 240. At 08:05, snapshot B includes an additional row of 40. The same calculation returns 280.
There is no contradiction in the arithmetic. The input changed. Calling both inputs “the sales data” hides the distinction that explains the result. In this example, the measure is simply the sum of recorded amounts. It is not a claim about recognised revenue, profit or a customer's performance. Those measures would require their own business definitions.
The useful record is therefore more than “total equals 240”. It includes the selected source, snapshot A, the three rows, the calculation and the absence of additional filters. The expected total is independently checkable: 100 + 80 + 60 = 240. Snapshot B has a separate expected total: 240 + 40 = 280. Keeping both makes the change explainable.
Distinguish the question from the state of the data
Three things can change independently: the question, the calculation and the data available to that calculation. A question about all recorded amounts can become a question about a particular region. A business definition can start excluding refunded orders. New rows can arrive while the wording stays identical. Each change deserves an explicit place in the investigation.
Even a database transaction is not a universal promise that successive queries see identical data. PostgreSQL documents that, at its Read Committed isolation level, successive SELECT commands can observe different committed data. That is a specific database behaviour, not a claim about every warehouse or connector. The broader practical lesson is to record the consistency conditions you actually used. PostgreSQL transaction isolation documentation
A timestamp alone may be insufficient to reproduce an old result. If the source overwrites records and retains no usable history, knowing when a query ran does not restore the old rows. Record the available snapshot, version, export or other reproducible reference. If none exists, say that exact replay is unavailable. An honest limitation is more useful than a misleading “reproducible” badge.
Keep a baseline before opening a new hypothesis
Now imagine the next question: what happens if we exclude refunded orders? Treat this as a new branch of the investigation. Preserve the original baseline, then record the changed filter and why it was introduced. Keep the data reference fixed while testing the definition. In our fixture, row O102 carries the amount 80 and the status refunded. Excluding that row from snapshot A produces 160. The original 240 remains saved. Otherwise, a changed result might reflect both a new filter and new incoming rows.
This is a proposed working method, not an instruction to exclude refunds from every measure. A finance team might need net revenue, gross bookings, refund volume or another measure entirely. Write the intended measure first. Specify how refund status, dates, currencies and corrections affect it before judging a result as right or wrong.
For each branch, keep a short description of the hypothesis, the version of the rule, the exact query or calculation, the active filters and the result. State what changed from the baseline. If one branch answers a different business question, label that difference. Two plausible numbers can both be valid answers to different questions.
Centralised metric definitions can support this discipline. For example, dbt documents defining metrics in a semantic layer and consuming them through downstream tools. That is useful context, not an exclusive DUKE claim. An investigation still needs to identify which definition and data reference its particular result used. dbt Semantic Layer documentation
Save the reasons behind the choices
Reproducing a number is only part of a handover. The next analyst also needs to understand why a particular path was selected. Perhaps one comparison used incomplete periods. Perhaps a segment was too small to interpret. Perhaps an apparent increase disappeared when the population was held constant. These are examples of reasoning to document, not events claimed to have happened in a customer project.
A useful note can be short: “The refund-exclusion branch changes the refund rule; it does not refresh the data. We retain baseline A for the original question.” Another might read: “We cannot compare these two outputs yet because their source versions differ.” Save that explanation beside the result it concerns, rather than leaving it buried in an unrelated conversation.
Also preserve the open question. An investigation should make its uncertainty visible enough for someone to continue. State which assumption remains untested and what evidence would change the conclusion. A clean final chart can otherwise make unfinished reasoning look settled.
Make the handover test concrete
Give a colleague the investigation without a live walkthrough. Ask them to recover the initial question, locate the data reference and reproduce the baseline result. Then ask them to identify the changed filter in the alternative branch and explain why one result was selected or why no decision was reached.
Do not treat disagreement as an automatic failure by the colleague. It may reveal an ambiguous definition, missing evidence or an unsupported choice in the original work. Record the point where they needed clarification. That is a precise improvement to make, and it is more informative than asking whether the chart “looks clear”.
Next, let them continue with a new question while preserving the original result. The test succeeds when the earlier conclusion remains inspectable and the new work shows what changed. It should also be possible to stop because the evidence is insufficient. A system that confidently invents missing context has not passed the test.
Share the investigation within the right boundaries
Keeping context does not mean copying every source into an unrestricted folder. The person receiving the investigation must have appropriate access to the underlying material. A saved result can itself contain sensitive information. Decide which parts can be shared, which references require fresh permission checks and how the team handles a later revocation.
Separate access to a record of past work from permission to execute a new query. A historical explanation can remain useful even when the recipient cannot access every original row. That limitation should be visible. The handover should never imply that a shared chart grants authority to retrieve or redistribute its source data.
The design direction for DUKE
The direction we want to explore is a working surface where the question, reference, alternatives and explanation stay together. A new hypothesis would create a visible branch. A refreshed source would create a visible change. A colleague would see enough context to check the result and decide what to investigate next.
Those are acceptance criteria to demonstrate, not features we can declare complete by writing them in an article. The fictional dataset provides a small starting test. A useful evaluation should then use a relevant business question, an agreed definition and a known expected result, with failures recorded as carefully as successes.
Bring an analysis that another person needs to continue: explore DUKE.